 Genesis of Eden

John and Mary Gribbin - New Scientist 13th July 1996
WE ON Earth are essentially the same distance from the Sun as is the Moon. Both our planet and the Moon receive the same amount of heat, averaged over the year, per square metre of their surface. Yet the Earth's average surface temperature is 15 C, while the Moon's is -18 C. This difference - a crucial one, as we shall see - is all down to the fact that the Earth has an atmosphere which, rather like a blanket, traps heat that would otherwise escape into space. The warming of the surface that results is called the greenhouse effect. Often cited solely as the culprit in climate change, the greenhouse effect is in fact a good thing, keeping our planet comfortably warm and suitable for life as we know it. Remarkably, it is minor components of the atmosphere-notably carbon dioxide (CO2) and water vapour-that are responsible for this vital task. Small amounts of these gases, known as greenhouse gases, have a big effect on temperature at the Earth's surface, and because of this the scientific community is concerned that human activity, and particularly adding more CO2 to the atmosphere by burning fossil fuel, may be upsetting the natural balance. Greenhouse gases added in this way are known as "anthropogenic", and are small in volume when compared with the bulk of the atmosphere, but large compared with the amount of natural greenhouse gases present before the start of the Industrial Revolution. Although it is called the greenhouse effect, the process does not, in fact, involve trapping heat in the same way that a glass greenhouse does. The important feature of a greenhouse is that when the air inside it warms up, it cannot escape by convection. So the way to regulate the temperature inside a greenhouse is to open or close ventilators in its roof. The Earth's greenhouse effect operates in a different way. The Sun's energy radiates mainly in the visible part of the spectrum; this is why the radiation is visible as sunlight-our eyes have evolved to make use of what is available. This radiation, with wavelengths that range from 0-4 to 0.7 micrometres, passes through the Earth's atmosphere essentially unaltered, apart from a fraction reflected back into space. Even longer wavelengths, in the near infrared part of the spectrum, get through the air to warm the surface of the Earth.

Energy from the Sun Trapping the Heat
THE SUN'S surface temperature determines the nature of its radiation, and in particular where in the spectrum its energy output peaks. Essentially, the Sun radiates energy as a so-called black body-that is, with very little radiation at the long and short wavelengths and a peak of intensity somewhere in-between. The radiation that the Sun produces in the visible spectrum corresponds to a temperature of just under 6000 K (Figure 2). Warmth from the Sun heats the surface of the Earth, which radiates energy in its turn. In equilibrium, the Earth radiates back into space exactly the same amount of energy that it receives from the Sun, but at a much lower temperature-about 15 'C. The black body spectrum corresponding to this temperature has a peak not in the visible waveband but in the infrared, chiefly in the range from 4 to 100 micrometres. Some of this outgoing radiation from the Earth's surface is trapped in the atmosphere, close to the ground. Water vapour strongly absorbs radiation with wavelengths ranging from 4 to 7 micrometres, and C02 absorbs in the range from 13 to 19 micrometres. There is, however, a "window" between 7 and 13 micrometres through which more than 70 per cent of the radiation from the Earth's surface eventually escapes into space. The trapped radiation warms the lower part of the Earth's atmosphere, the troposphere. In turn, this warmed air then radiates energy - largely in the infrared - in all directions. Some of this radiation works its way upward and out from the highest part of the atmosphere, but some finds its way back down to the Ear-th's surface, keeping it hotter than it would otherwise be. This is the greenhouse effect. Because the temperature of the troposphere decreases the higher you go, the net effect is that each layer absorbs energy radiated from below, at warmer levels, and passes it upward, ultimately to escape into space. The overall effect is that less infrared radiation is lost, so the surface, and each intermediate layer, warms up until an equilibrium of absorption and radiation is restored.
The human factor Searching for sinks
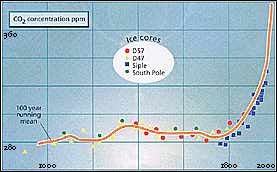
AS WE have noted, human activity, by increasing the amount of CO2 in the atmosphere, adds to the natural greenhouse effect. Other anthropogenic greenhouse gases add to the effect by absorbing radiation in the window from 7 to 13 micrometres, which used to escape freely into space. The system is, however, slightly more complicated than this. When the world warms a little because of an increase in the atmospheric concentration of CO2 more water evaporates from the ocean and 3 enters the atmosphere. This added water vapour itself contributes to the greenhouse effect, increasing the temperature by another small increment. The water vapour in fact makes a bigger contribution to the resultant warming than the CO2 that initially caused 3 the rise in temperature. But the natural state still tends towards equilibrium - provided the concentration of CO2 stays the same-and all these feedbacks are '2 allowed for in computer models of global warming. These models-discussed in detail below-are simplified 30 computer representations of the global climate. Measurements of temperature and other data are entered and processed to help predict how the climatic system will behave over time. Long before computers came onto the scene, however, scientists knew about 26 the greenhouse effect. As early as 1827, the French polymath Jean-Baptiste Fourier suggested the existence of an effect keeping the Earth warmer than it would otherwise be, and was the first person to make the analogy incorrect, as we have seen-with the action of panes of glass in a greenhouse. John Tyndall, an Irish scientist, published a paper in the Philosophical Magazine in 1863 about the effect of water vapour as a greenhouse gas. In the 1890s, the Swedish scientist Svante Arrhenius and an American, P. C. Chamberlain, both considered the problems that might be caused by a build-up of CO2 in the air. They realised that the ongoing combustion of coal, the main fossil fuel of the time, could lead to global warming. In the early part of the 20th century, average surface air temperatures did increase slightly, rising by about 0-25 'C between 1880 and 1940. In the years following the US dustbowl of the 1930s, some scientists suggested that this was a sign of the anthropogenic greenhouse effect at work. But between 1940 and 1970 there was a worldwide cooling of 0-2 'C, and the possibility of the global temperature rising as the result of the anthropogenic greenhouse effect was not a major subject of scientific research. Then, new measurements of the amount of CO2 in the atmosphere, which began to show a significant increase, stimulated a wave of scientific activity in e 1970s. It was forecast that the pre-industrial concentration of CO2 would double, causing the world to warm by about 2 'C. There is now no doubt that since 00 the 19th century the amount of C02 and other anthropogenic greenhouse gases in the atmosphere has increased dramatically, and the average temperature of the world has also increased, if rather erratically. Questions remain about how much of the global warming can be blamed on the build-up of anthropogenic greenhouse gases, and how rapidly the world is likely to warm in the 21st century if-as seems inevitable-this build-up continues. The best figures currently available come from the 1996 report of the Intergovernmental Panel on Climate Change (IPCC), the independent scientific advisory body of the Climate Change Convention signed at Rio (see Box 1). The IPCC projects a most likely warming of 2 'C by the year 2100, with a corresponding rise in sea level ofjust under 0-5 metres. But just how these changes would alter rainfall and other weather patterns is as yet far from clear. Researchers had begun to take accurate measurements of the amount of C02 in the air at Mauna Loa, Hawaii, and at the South Pole during the international Geophysical Year, 1957-58. These measurements are an important guide because they are taken far away from any major sources of industrial pollution, and represent the "well-mixed" state of the atmosphere. They show a clear seasonal rhythm, associated with changes in the activity of vegetation over the land masses of the Northern Hemisphere. (The Earth's vegetation "breathes" CO2 in and out over an annual cycle, and the effect is dominated by the Northern Hemisphere because there is more land there.) By the 1970s, however, it became clear that this annual cycle was superimposed on a rising trend of global mean CO2 concentration. This has now been borne out by studies of bubbles of old air trapped in the ice in Antarctica (Figure 3).

A burning issue Gases on the rise
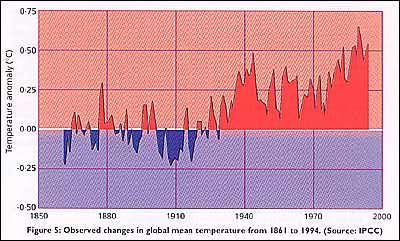
IN 1957, the concentration of CO2 in the atmosphere was 315 parts per million (ppm). It is now 360 ppm, that is, 0-036 per cent. Before the Industrial Revolution, the CO2 concentration was below about 280 ppm. Most of the extra carbon required to make the C02 has come from burning coal and other fossil fuel; while part of the increase may be due to the destruction of tropical forests. When 1 tonne of carbon is burnt, say in the form of coal, it produces about 4 tonnes of C02, as each carbon atom combines with two oxygen atoms from the air. In the 1980s, some 5 gigatonnes (5 billion tonnes, or 5 Gt) of carbon were being burnt in the form of fossil fuel each year, so the annual input of CO2 to the atmosphere from this source was about 20 Gt. The observed increase in the C02 content of the atmosphere, however, corresponds to just under half the amount of CO2 human activities produce each year. Roughly half of the C02 we produce is absorbed by what are known as natural sink or sinks. Vegetation-including not just forests but also the biomass of the soil and the sea, both of which are dominated by microorganisms is a vital sink, growing more vigorously in an atmosphere enriched with CO2. Some of the C02 may also dissolve in the oceans. One potential cause for concern is the possibility that whatever the natural sinks are, they may one day "fill up" and stop absorbing CO2 - if this happened, the rate at which CO2 is building up in the atmosphere could double. Between 1850 and 1950, roughly 60 Gt of carbon were burnt, again chiefly as coal. The same amount of carbon is now being burnt every decade. Researchers estimate from the known amount of fossil fuel burnt, that in the middle of the 19th century the natural concentration of C02 in the atmosphere was about 270 ppm. This is confirmed by those measurements of the composition of air bubbles which have survived after being trapped in the polar ice sheets before industrialisation began. Further studies of air bubbles in ice cores drilled from the Antarctic ice sheet show that this concentration has stayed roughly constant since the end of the most recent major ice age, for at least 10 000 years. So calculations of the likely effect of the build-up of CO2 and other greenhouse gases in the atmosphere are usually reported in terms of the overall effect normalised to this background level of 270 ppm. Taking C02 alone, the increase in concentration above the background level is already 33 per cent, and other gases, such as the chlorofluorocarbons (CFCs), are also contributing to the anthropogenic greenhouse effect. This is causing a significant upset to the natural system. - In addition to C02, gases which are being released by human activities, and which absorb infrared radiation in the range from 7 to 13 micrometres, include CFCS, methane, nitrous oxide and ozone. CFCs are better known as the chemicals responsible for depletion of the ozone layer in the stratosphere. They are also extremely efficient greenhouse gases: a single molecule of either of the two most common CFCs has the same greenhouse warming effect as 10 000 molecules of C02. The release of CFCs may now have passed its peak, because of concern about ozone depletion; but these substances linger for a long time in the atmosphere and will continue to contribute to the greenhouse effect throughout the 21st century. Methane has a very low atmospheric concentration ofjust under 2 ppm, but this is increasing at a rate of about 1 .2 per cent a year. The biological activity of bacteria in paddy fields is probably to blame, along with the release of natural gas from commercial oil and gas fields. Nitrous oxide, released by the use of nitrogen-based fertilisers, now has an atmospheric concentration of just under 0-4 ppm. Ozone is also increasing in the troposphere as a result of human activities. In 1985, Veerhabadrhan Ramanathan of the University of Chicago calculated the combined effect of all these greenhouse gases, P'US C02, and projected the growth in concentration of the gases in the air forward into the 21st century. He concluded that by the year 2030, the minor contributions from the gases other than C02 would add up to as big an effect as the extra C02 in the air, and that the total effect (including CO2) would be as if the natural concentration of C02 had doubled. At that time, computer models suggested that this would imply a global warming of some 3 'C above the level of the mid-19th century (Figure 4). Of this projected 3 'C rise in temperature, about 0-5 'C has already happened (Figure 5), and although natural fluctuations in climate may have caused some of this warming, the actual rise in temperature since the 19th century is in line with computer models of the anthropogenic greenhouse effect expected from the build-up of CO2 and other gases over that period. In the context of climatic records, the 1980s was the warmest decade, with seven of the eight warmest years up to 1990 - the warmest year to date. To put this into perspective, the coldest years of the 1980s were warmer than the warmest years of the 1880s This warming trend was interrupted after 1990, but in a way that itself showed how accurate the computer models which describe global warming are. The trigger for the interruption was Mount Pinatubo, a volcano in the Philippines, which erupted in June 1991 and threw an enormous amount of debris into the stratosphere. This material spread around the globe, par tially shielding the surface of the Earth from incoming solar energy. The same computer models used in calculations of the green house effect predicted that in the short term, the debris would cool the Earth's atmosphere dramatically, temporarily returning average temperatures to the level of a century ago. This predicted cooling duly ocurred over the following two years.
The models also predicted that as the volcanic debris cleared from the atmosphere in 1992 and 1993, average temperatures would swiftly return first to the level of the 1980s, and then, by the middle of the 1990s, to the slightly higher levels that would be expected with the ongoing build-up of greenhouse gases. Data for 1994 and 1995 show that these predictions were fully borne out, with 1995 itself failing by a hair's breadth to be the warmest year on record-within the limits of statistical uncertainty, it equalled the record set in 1990. Mount Pinatubo was not the only recent factor in global cooling. Humans play a part, too; and since the mid-1980s, was only with the advent of clean air legislation after the Second World War that the aerosol cleared from over the region, bringing a rapid warming as it caught up with the rest of the world. The best projections for the 21st century come from the IPCC report mentioned above. It predicts that global warming by the year 2100 will be in the range of 1 'C to 3-5 'C, with a "best estimate" of 2 'C. Sea level (see Box 2) will rise as a result, both because of melting glaciers and ice caps and because, as the top layer of ocean warms, it will expand. The predicted rise by the year 2100 is between 15 centimetres and 90 centimetres, with a best estimate of 48 centimetres. This will place 9 million people at risk from flooding. The "best" warming rate predicted by the IPCC study is 0-2 'C per decade. To put that in perspective, the predicted rate of change is about 50 times faster than the warming which brought an end to the last major ice age which, up to that point, was itself the largest sustained natural change in climate for the past 100 000 years.
Rising sea levels and melting ice
THE OTHER immediate effect of an increase in global mean temperatures is a rise in sea level. This is already happening. Sei level has risen by about 15 centimetres during the 20th century, and the rise is very much in line with the rise in temperature that has occurred over the same interval. Most of this rise can be explained simply in terms of the thermal expansion of sea water. Only a little extra water has been added to the sea, from melting glaciers on mountains at low latitudes. Paradoxical though it may seem, at present the polar ice caps may be increasing in size. This is because more moisture is evaporating at low latitudes, and falling as snow near the poles, where it is still cold. A global warming of out 2 'C, possible within 40 years, will increase sea level by a further 30 centimetres. But one "scare story" associated with the greenhouse effect is dismissed by the experts. This is the fear that the entire West Antarctic ice sheet might collapse, sliding into the ocean and raising sea level world-wide. Some calculations do suggest that once the world warms by about 4 'C (which could happen within the next hundred years) the ice sheet might "collapse". But what glaciologists mean by a collapse is still a slow process by everyday standards-it would take several hundred years for all the West Antarctic ice to slide into the sea, eventually raising sea levels by 5 metres or more, but only at a rate of 1 or 2 centimetres a year. There would be ample time to walk out of harm's way, although the impact on coastal cities and low-lying countries, such as Bangladesh and the Netherlands, would be catastrophic in the long term.
SPURRED on by concern over new measurements of carbon dioxide in the atmosphere, in 1988 the World Meteorological Organization and the United Nations Environment program began a global initiative to combat the problem - the Intergovernmental Panel on Climate Change (IPCC). The IPCC assesses research and policy options on climate change and reports on the risks of global warming. Its scientific working group alone draws on contributions from hundreds of researchers. In 1990, the IPCC issued a report that shook the world, claiming that only strong measures to halt rising greenhouse gas emissions would prevent a dangerous rise in global warming. (The latest figures from the IPCC study group, some of which are used in this Inside Science, were published in June 1996.) The fruit of the IPCC's labour-the Climate Change Convention-was finally signed in 1992 at the Earth Summit in Rio, and ratified in 1993. The convention's aim is to stabilise greenhouse gases in the atmosphere at 1990 levels by the year 2000. Are we getting any closer to making this happen? Many of the convention's signatories have dragged their feet over reducing emissions by the target date. And doubts have dogged the science behind the IPCC's reports: issues such as how far sea level will rise have generated fierce debate. But however embroiled in political and economic battles it becomes, the phenomenon of global warming itself marches on.